Quick start
Installation
The easiest way to install it is using PyPI:
pip install bandicoot
Alternatively, you can download it from here. Once unzipped you can either import it import bandicoot as bc or install it:
python setup.py install
Loading data
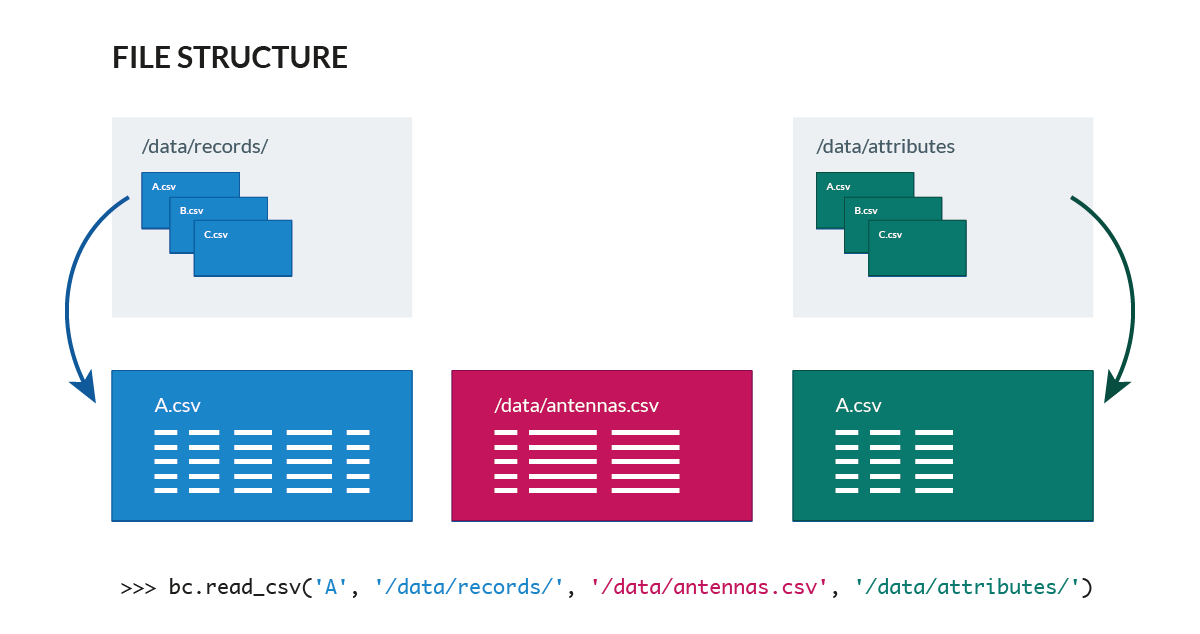
bandicoot takes one file per user and assume that all user records are in the provided directory records/:
>>> B = bc.read_csv('my_user', 'records/', 'antennas.csv')
This read_csv() will load records for the user my_user from records/my_user.csv and will load antennas from the file antennas.csv. Optionally, bandicoot can also load a file containing attributes for this user.
bandicoot uses one record file per user. Record files are structured as follows:
| interaction | direction | correspondent_id | datetime | call_duration | antenna_id |
|---|---|---|---|---|---|
| call | in | 8f8ad28de134 | 2012-05-20 20:30:37 | 137 | 13084 |
| call | out | fe01d67aeccd | 2012-05-20 20:31:42 | 542 | 13084 |
| text | in | c8f538f1ccb2 | 2012-05-20 21:10:31 | 13087 |
records.csv:
interaction,direction,correspondent_id,datetime,call_duration,antenna_id
call,in,8f8ad28de134,2012-05-20 20:30:37,137,13084
call,out,fe01d67aeccd,2012-05-20 20:31:42,542,13084
text,in,c8f538f1ccb2,2012-05-20 21:10:31,,13087
while the antennas file contains the latitude and longitude coordinates of the antennas:
antenna_id,latitude,longitude
13084,42.360888,-71.0877297
13087,42.367709,-71.107692
Computing indicators
The behavioral indicators can be computed by individual functions such as response_rate_text() and radius_of_gyration() or by using all() which returns all the indicators defined in individual and spatial.
>>> B = bc.tests.sample_user()  # Load a sample user
>>> bc.utils.all(B)
{
    "name": "sample_user",
    "reporting": {
        "antennas_path": None,
        "attributes_path": None,
        "recharges_path": None,
        "version": "0.6.0",
        "code_signature": "9f648eb0aa73d5e521c7e8a2bf8256697a467bdf",
        "groupby": "week",
        "split_week": false,
        "split_day": false,
        "start_time": "2012-01-01 00:14:24",
        "end_time": "2012-02-27 10:52:45",
        "night_start": "19:00:00",
        "night_end": "07:00:00",
        "weekend": [
            6,
            7
        ],
        "number_of_records": 1482,
        "number_of_antennas": 7,
        "number_of_recharges": 0,
        "bins": 10,
        "bins_with_data": 10,
        "bins_without_data": 0,
        "has_call": true,
        "has_text": true,
        "has_home": true,
        "has_recharges": false,
        "has_attributes": false,
        "has_network": true,
        "percent_records_missing_location": 0.0,
        "antennas_missing_locations": 0,
        "percent_outofnetwork_calls": 0.21864406779661016,
        "percent_outofnetwork_texts": 0.23878923766816143,
        "percent_outofnetwork_contacts": 0.20833333333333334,
        "percent_outofnetwork_call_durations": 0.22626362451481688,
        "ignored_records": {
            "call_duration": 0,
            "correspondent_id": 0,
            "location": 0,
            "direction": 0,
            "datetime": 0,
            "all": 0,
            "interaction": 0
        }
    },
    "active_days": {
        "allweek": {
            "allday": {
                "callandtext": {
                    "mean": 5.4,
                    "std": 2.33238075793812
                }
            }
        }
    },
    "number_of_contacts": {
        "allweek": {
            "allday": {
                "call": {
                    "mean": 31.9,
                    "std": 10.681292056675542
                },
                "text": {
                    "mean": 36.7,
                    "std": 13.092364186807515
                }
            }
        }
    },
    [...]
    "frequent_antennas": {
        "allweek": {
            "allday": {
                "mean": 5.2,
                "std": 0.6
            }
        }
    },
    "churn_rate": {
        "mean": 0.1130055840243805,
        "std": 0.10223558001224502
    }
}
all() returns a nested dictionary with all indicators (individual, spatial) and some reporting metrics (the name of the user, groupby, the version of bandicoot used, the number of records_missing_locations, etc)
By default, bandicoot computes the indicators on a weekly basis over all the weeks for which data is available. The indicators from each week are computed, and their averages and standard deviations are returned. bandicoot defines weeks as beginning on a Monday and ending on a Sunday. The parameter groupby=None can be used to compute the indicators over the entire timeframe instead.
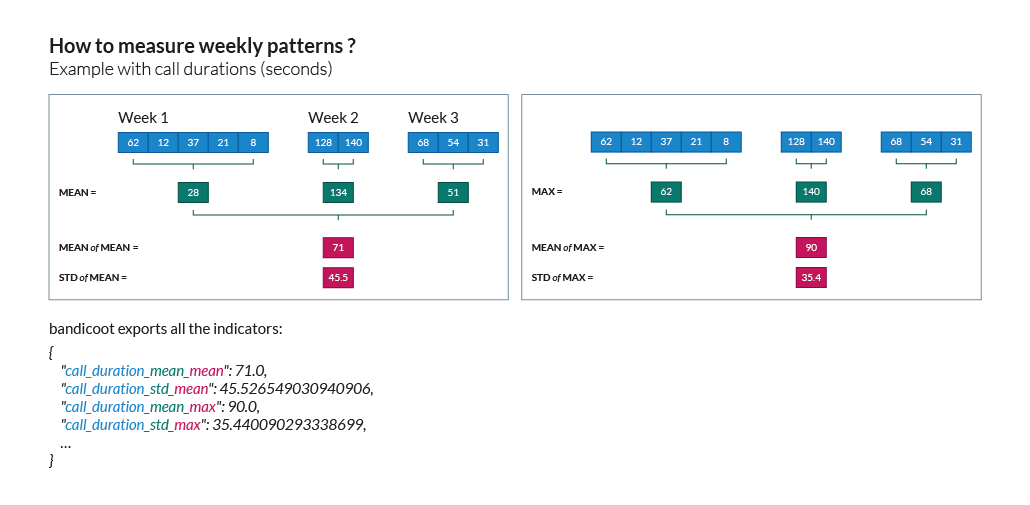
Note that, while some indicators return a mean and a std per time period (e.g., each week), others return only one value. For example, percent_initiated_interactions() and active_days() return only one value per time period, the percentage of interactions initiated by the user and the number of days he has been active. Others, such as call_duration() will return the mean and std of the value over the time period (28 seconds on average with a standard deviation of 19.7 seconds for the first week). If passed summary=extended, bandicoot will also return the median, min, max, kurtosis, and skewness (among the values from each time period):
>>> bc.individual.call_duration(B, groupby=None)
{
    "allweek": {
        "allday": {
            "call": {
                "mean": 473.3491525423729,
                "std": 289.76535239471673
            }
        }
    }
}
>>> bc.individual.call_duration(B, summary='extended', groupby=None)
{
    "allweek": {
        "allday": {
            "call": {
                "mean": 473.3491525423729,
                "std": 289.76535239471673,
                "median": 484.5,
                "skewness": 0.03923009561302253,
                "kurtosis": 1.7678711979383712,
                "min": 2.0,
                "max": 997.0
            }
        }
    }
}
Note that summary=extended can also be passed to all().
Exporting indicators
Once computed using all(), the indicators of one or several users can be easily exported using to_csv() and to_json().
>>> features = [bc.utils.all(user, groupby=None) for user in [B, other_user]]
>>> bc.io.to_csv(features, "bandicoot_indicators.csv")
Successfully exported 2 objects to bandicoot_indicators.csv
will flatten the dictionaries and write the indicators in a CSV file with a header and one line per user:
name,reporting__antennas_path,reporting__attributes_path,reporting__version,reporting__grouping_method,reporting__start_time,reporting__end_time,reporting__bins,reporting__has_call,reporting__has_text,reporting__has_home,reporting__percent_records_missing_location,reporting__antennas_missing_locations,reporting__percent_outofnetwork_calls,reporting__percent_outofnetwork_texts,reporting__percent_outofnetwork_contacts,reporting__percent_outofnetwork_call_durations,reporting__nb_records,reporting__ignored_records__all,reporting__ignored_records__interaction,reporting__ignored_records__correspondent_id,reporting__ignored_records__call_duration,reporting__ignored_records__direction,reporting__ignored_records__datetime,active_days__callandtext,number_of_contacts__text,number_of_contacts__call,call_duration__call__std,call_duration__call__mean,percent_nocturnal__text,percent_nocturnal__call,percent_initiated_conversations__callandtext,percent_initiated_interactions__call,response_delay_text__callandtext__std,response_delay_text__callandtext__mean,response_rate_text__callandtext,entropy_of_contacts__text,entropy_of_contacts__call,balance_of_contacts__text__std,balance_of_contacts__text__mean,balance_of_contacts__call__std,balance_of_contacts__call__mean,interactions_per_contact__text__std,interactions_per_contact__text__mean,interactions_per_contact__call__std,interactions_per_contact__call__mean,interevent_time__text__std,interevent_time__text__mean,interevent_time__call__std,interevent_time__call__mean,percent_pareto_interactions__text,percent_pareto_interactions__call,percent_pareto_durations__call,number_of_interactions__text,number_of_interactions__call,number_of_interaction_in__text,number_of_interaction_in__call,number_of_interaction_out__text,number_of_interaction_out__call,number_of_antennas,entropy_of_antennas,percent_at_home,radius_of_gyration,frequent_antennas
sample_user,,,0.2.3,,2012-01-01 00:55:56,2014-11-27 00:31:44,1,True,True,True,0.0,0,0,0,0,0,1960,0,0,0,0,0,0,800,150,149,288.20204,509.09016,0.9065,0.91803,0.50813,0.48873,,,0.0,4.92907,4.9139,0.00175,0.00339,0.00196,0.00328,2.5961,6.56,2.73048,6.55034,110028.24,88312.70905,107264.44395,88859.44308,99,96,94,984,976,484,499,500,477,7,1.94257,0.15508,1.53683,6
other_user,...
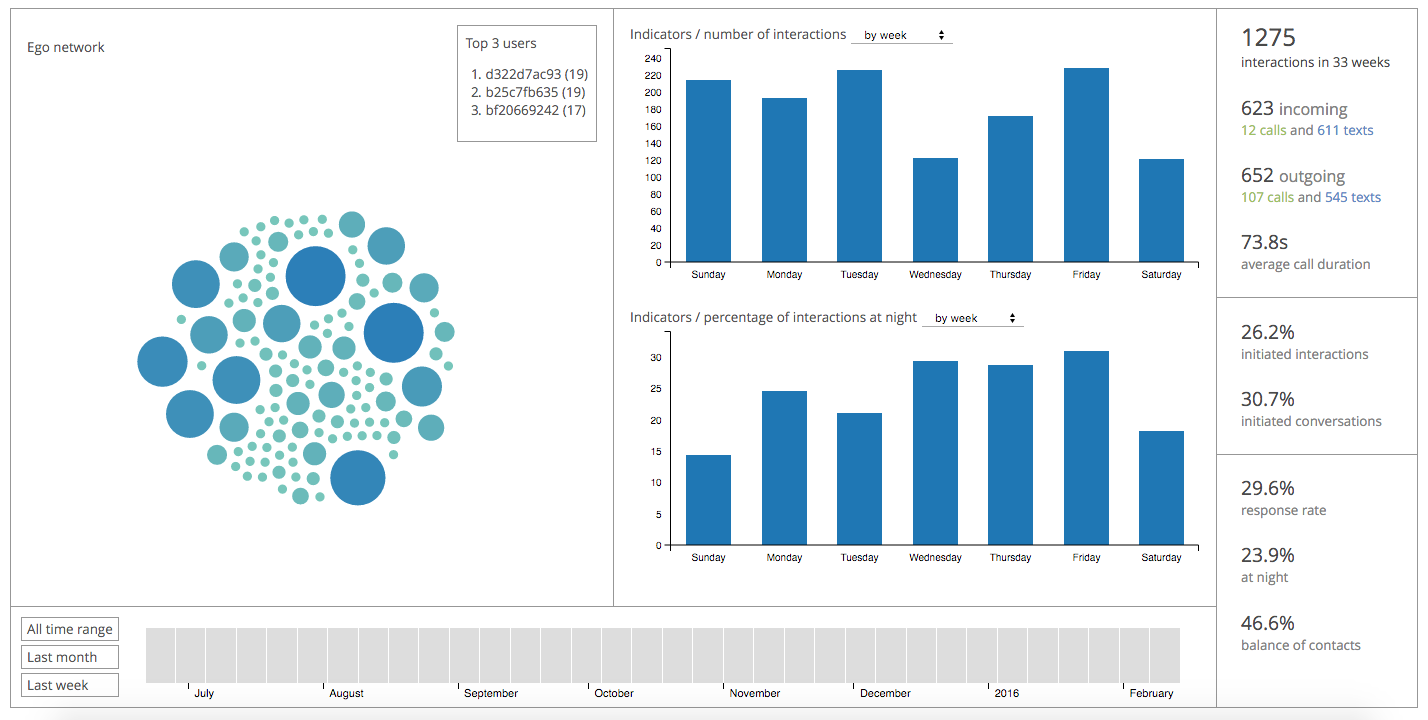
Visualizing a user
bandicoot provides an interactive dashboard to quickly visualize a user:
>>> bc.visualization.run(U)
Successfully exported the visualization to /var/folders/n_/hmzkw2vs1vq9lxs4cjgt2gmm0000gn/T/tmpv3rxwkgr
Serving bandicoot visualization at http://0.0.0.0:4242
The visualization can be served locally, or exported to a given folder. See visualization for more information.
Full pipeline
The following code will load all the users in one directory, compute the indicators, and export them to a csv file:
import bandicoot as bc
import glob, os

records_path = 'users/'
antenna_file = 'antennas.csv'

indicators = []
for f in glob.glob(records_path + '*.csv'):
    user_id = os.path.basename(f)[:-4]

    try:
        B = bc.read_csv(user_id, records_path, antenna_file, describe=False)
        metrics_dict = bc.utils.all(B)
    except Exception as e:
        metrics_dict = {'name': user_id, 'error': str(e)}

    indicators.append(metrics_dict)

bc.to_csv(indicators, 'bandicoot_indicators_full.csv')
The full pipeline file is available here. A parallel version using MultiProcessing is available here.